Chart Panels
Build charts from SQL queries
Panels are the building blocks of dashboards. Each panel runs a SQL query and displays results as a chart. Reuse panels across multiple dashboards.
-
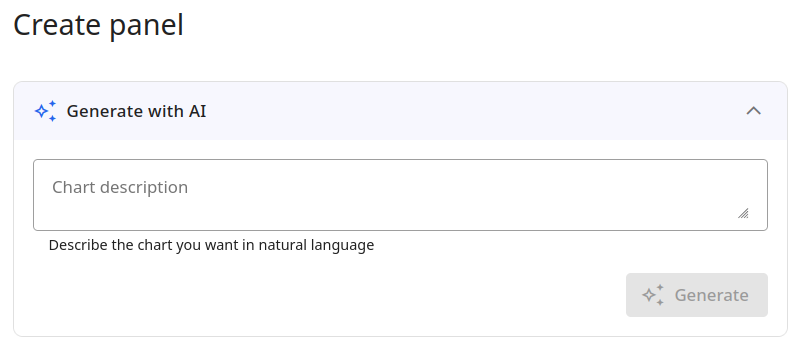
AI-generated charts
Describe the chart you want in plain English — AI generates the SQL query and chart configuration automatically
-
Manual SQL queries
Write custom SQL in a built-in Monaco editor. Test queries and preview results before saving
-
Read-only safety
All panel queries are validated to be read-only. Write operations are blocked — your data is never at risk
-
Reusable across dashboards
Panels are defined at the connection level. Add the same panel to multiple dashboards without duplication
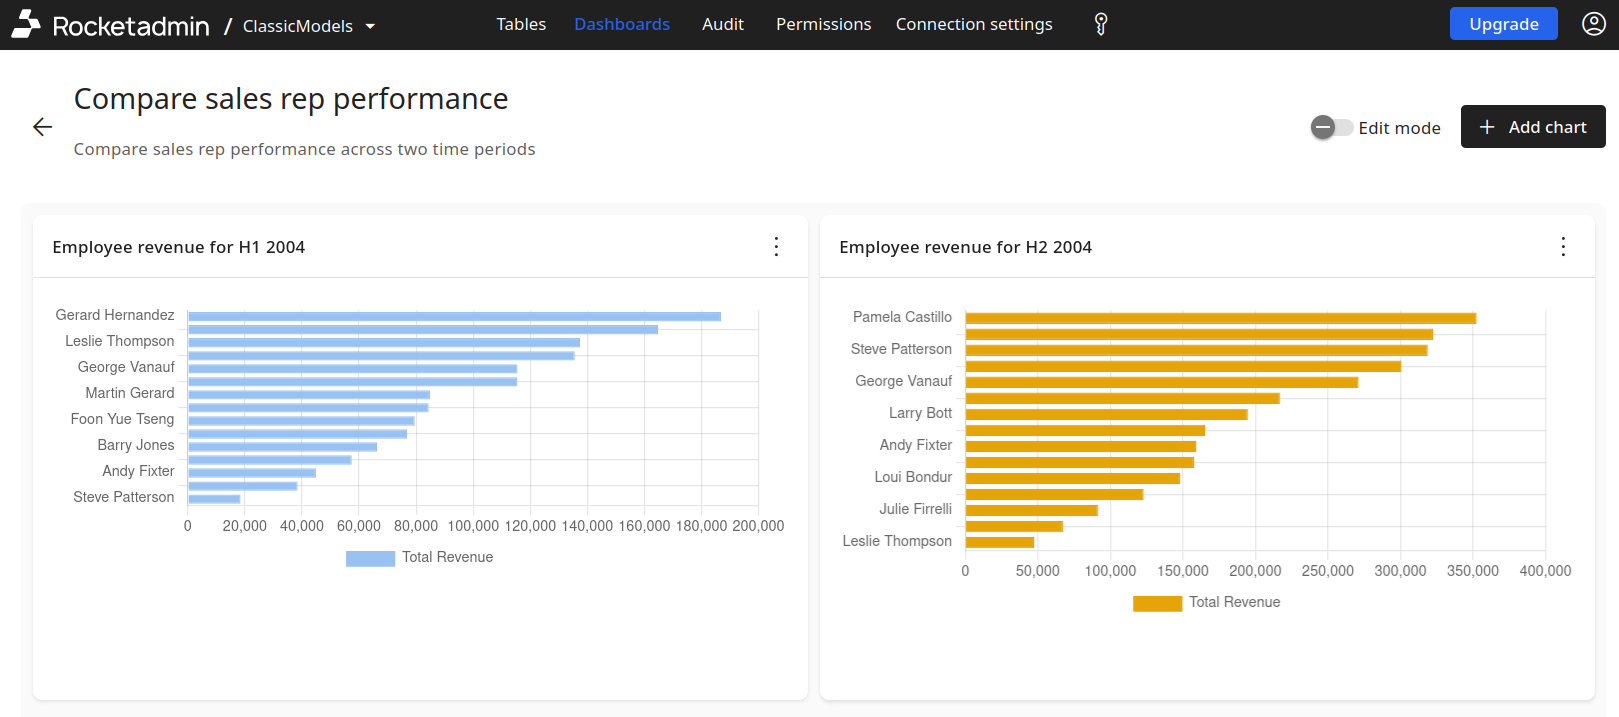
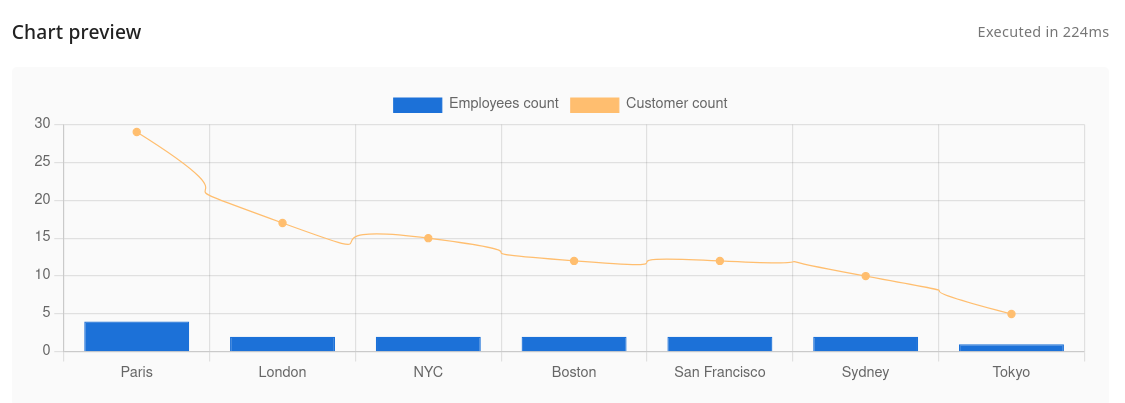
Chart Types
5 chart types, unlimited configurations
Configure multiple data series per chart, each with its own type, color, axis, fill, and point style.
Bar charts
Vertical or horizontal bars with stacking, custom colors, and data labels
Line charts
Trend lines with fill options, point styles, and multi-series overlays
Pie & doughnut
Proportional breakdowns with custom color palettes and label formatting
Polar area
Radial charts for comparing categories with equal angular segments
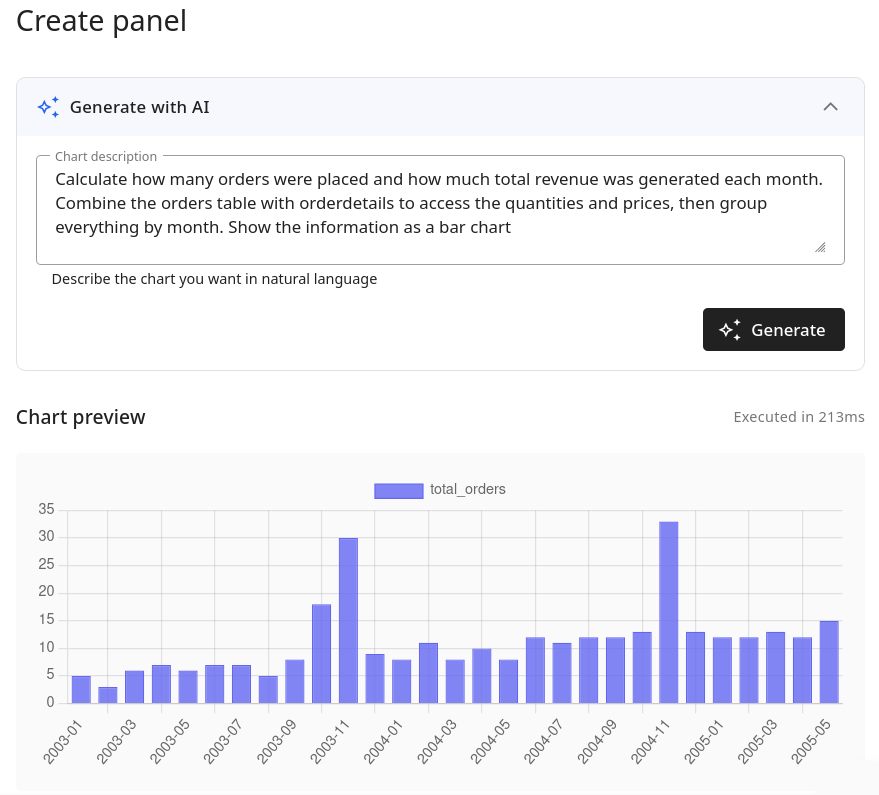
AI-Powered
Describe a chart, get a panel
The AI assistant understands your database schema and generates complete chart panels from natural language descriptions. Review the SQL query, preview the chart, then save it to any dashboard.
- 1
Describe what you need
Type a natural language prompt like "Show monthly orders as a bar chart"
- 2
Review the generated SQL
AI generates the query, chart type, and series configuration — review before saving
- 3
Add to any dashboard
Save the panel and add it to one or more dashboards — reuse it wherever you need
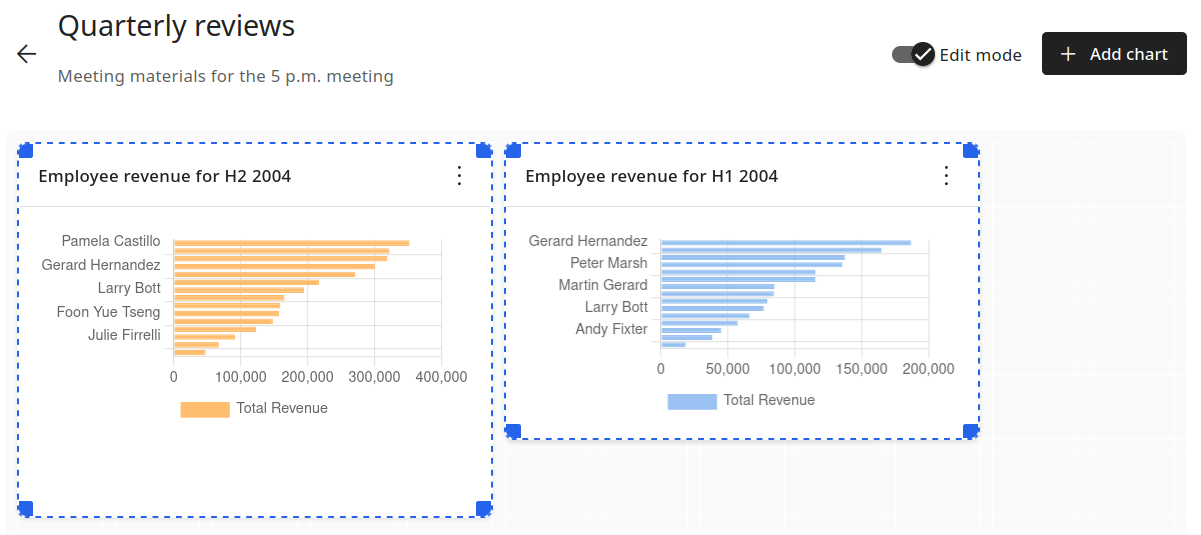
Dashboard Layout
Drag, resize, and organize
Toggle edit mode to rearrange and resize panels. Switch back to view mode when you're done — your layout is saved automatically.
- Drag-and-drop panel reordering
- Resize panels by dragging edges
- Toggle between edit and view mode
- Dashboard search and filtering
- Name and describe each dashboard
- Add or remove panels any time
Explore more features